
Your last board meeting ended with an awkward pause. The growth slide had a chart going up, but nobody at the table believed the trajectory would hold. The questions got specific. You did not have specific answers.
VCs are not vague about what they want. They have a mental model for how growth should look at each stage. If you do not match it, the conversation shifts from “how do we accelerate” to “should we extend the runway.”
What Founders Misread About VC Growth Expectations
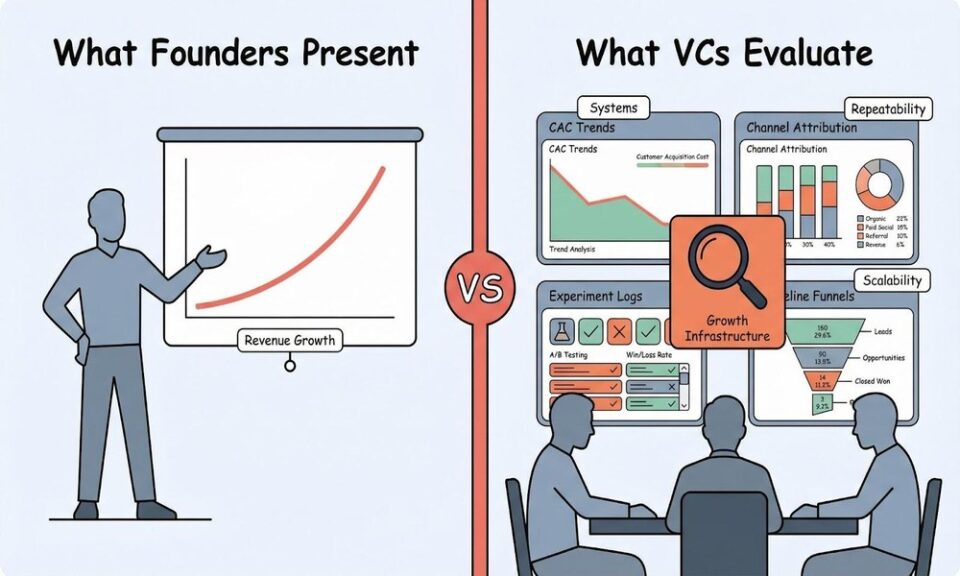
Most founders think VCs want revenue growth. They do. But that is table stakes. What they actually evaluate is the machine behind the growth. Can it scale? Is it repeatable? Does it survive a channel disruption?
A founder who grew 3x last year by personally closing every deal impresses no one at Series B. VCs want to see systems. Dashboards. Attribution models. A growth engine that works without the CEO in the loop.
The other misread: founders report activity metrics when VCs want efficiency metrics. Your board does not care that you ran 200 campaigns. They care about CAC trends, payback periods, and channel-level ROAS.
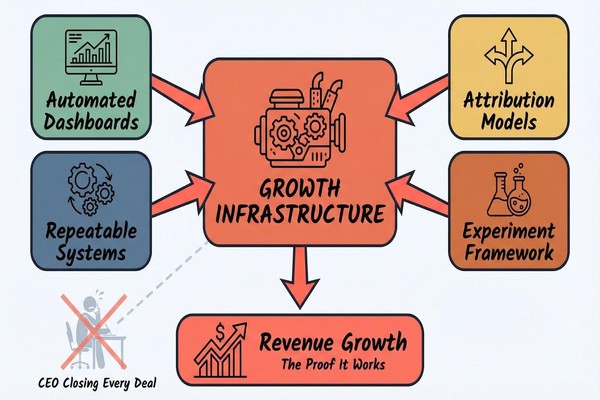
VCs do not fund growth. They fund growth infrastructure. The revenue is proof the infrastructure works.
The Metrics VCs Actually Track
CAC by Channel and Cohort
Blended CAC hides problems. VCs want to see acquisition cost broken down by channel, campaign type, and customer cohort. They are looking for whether your cheapest channel is scalable and whether your most expensive channel is worth keeping.
LTV:CAC Ratio With Payback Period
The ratio alone is not enough. A 5:1 LTV:CAC with a 24-month payback is a cash flow problem dressed as a good metric. VCs want the ratio and the timeline. Anything over 12 months payback at Series A raises questions.
Experiment Velocity and Win Rate
How many growth experiments does your team run per month? What percentage produce measurable improvement? This tells VCs whether your growth is systematic or lucky. Top-performing portfolio companies run 10-15 experiments monthly with a 20-30% win rate.
Pipeline-to-Close Conversion by Source
Not all leads are equal. VCs want to see which sources produce leads that actually close, and at what rate. This separates real demand generation from vanity lead volume.
Organic vs Paid Mix
Heavy paid dependency is a risk flag. VCs prefer a healthy split — ideally 40%+ organic — because it signals brand strength and reduces CAC pressure as you scale. The best teams invest in SEO, AI search optimization, and content alongside paid channels.
Building the Playbook Your Board Wants to See
Instrument everything before your next board meeting. Build automated dashboards that update daily with the metrics listed above. If your reporting requires manual data pulls, you are already behind. A growth agency with VC portfolio experience can stand this up in weeks, not months.
Tell a 3-quarter growth story. VCs think in trajectories. Show last quarter’s baseline, this quarter’s improvements with specific changes you made, and next quarter’s targets with the experiments planned to hit them. Data, decisions, projections. That is the narrative structure.
Benchmark against portfolio peers. Your investors have seen the growth data from every company in their portfolio. If you show up without context for how your metrics compare, they will provide it — and the framing will not be in your favor. Proactively benchmark your CAC, conversion rates, and growth rate against stage-appropriate companies.
Diversify your channel mix every quarter. Run at least one meaningful experiment in a new channel each quarter. This shows the board you are building resilience, not dependency. It also surfaces opportunities that single-channel operators miss entirely.
Hire or partner for growth infrastructure. The startups that impress boards have dedicated growth teams — either in-house or through a growth agency that has scaled companies across a16z, Sequoia, and YC portfolios. Solo founders running ad campaigns do not pass the pattern match VCs are looking for.
The Stakes Are Higher Than You Think
Portfolio companies that present structured growth playbooks raise follow-on rounds 40% faster than those that rely on topline revenue alone. That is not speculation. That is the pattern VCs describe when explaining why some Series A companies get bridge rounds and others get term sheets.
The math compounds in the other direction too. Companies that reduce CAC by even 37% change their unit economics enough to shift VC sentiment from “monitor” to “double down.” That shift determines whether your next board meeting ends with enthusiasm or a conversation about “optionality.”
Your competitors in the same fund’s portfolio are presenting automated dashboards, structured experiment logs, and data-backed projections. If your growth slide is a revenue chart with no supporting infrastructure, the comparison is obvious. VCs see every company in the portfolio side by side. The ones with real growth playbooks get the follow-on capital. The ones without it get advice to “figure out distribution.”